Introducing Call Widgets: A Smarter Way to Manage Conversations in Your CRM
Every missed call has the potential to be a missed opportunity—whether it's a lost sale, an unserved client, or a delayed follow-up. Recognizing this, our CRM now introduces Call Widgets for the Dashboard, a game-changing feature that brings clarity and control to your communication strategy. Instead of relying on scattered reports or basic metrics, you can now access real-time data through sleek, customizable dashboards designed to show you exactly what you need.
These Dashboard Widgets give you the power to visualize everything from outgoing calls and first-time incoming calls to the percentage of calls answered and average duration. Tailor your layout with multiple individual widgets, including Calls by Status, agent performance widget, and even a queue summary widget for a full-spectrum view of your call center or sales activity.
Configuration is simple and flexible. Use the drop-down list to customize your filters, select data by agent or queue, and add metrics with ease. With drag-and-drop functionality, dynamic layout options, and an intuitive setup process, these widgets not only save time—they help drive smarter decisions. Transform your dashboard into a live, strategic workspace that empowers teams to respond quickly, measure accurately, and perform confidently.
Introducing Call Widgets: A Smarter Way to Manage Conversations in Your CRM
Why does it matter to your business?
How To Use New Call Widgets For The Dashboard:
Deeper Insights with Rich Metrics
Flexible Configurations for Teams of All Sizes
Empowered by Tech: Built on Robust Architecture
Why does it matter to your business?
Visual Insights: With real-time Dashboard Widgets, visualize Outgoing Calls, first-time incoming calls, and Calls by Status. No more guessing which individual agent is handling the most traffic—now, you can see it all in one place.
Customizable Dashboards: Tailor your Dashboard list to fit your exact needs. Add individual widgets like the agent performance widget, Appointment Widgets, or even a queue summary widget to track and fine-tune your operations.
Effortless Widget Configuration: Quickly add, edit, or remove individual widgets using the intuitive interface. Options like the gear icon, trash icon, and three-dot menu icon make configuration seamless.
How To Use New Call Widgets For The Dashboard:
Open the dashboard from the left-hand navigation panel and select the Edit Dashboard option.

Click the Add Widget button.

Choose the newly added Calls tab.

Insert the call widget based on your specific needs.

Once added, click Configure and complete all required fields.

Go to Advanced Settings and fill in the necessary information.

Navigate to the Conditions tab to define your custom rules, then click Save.

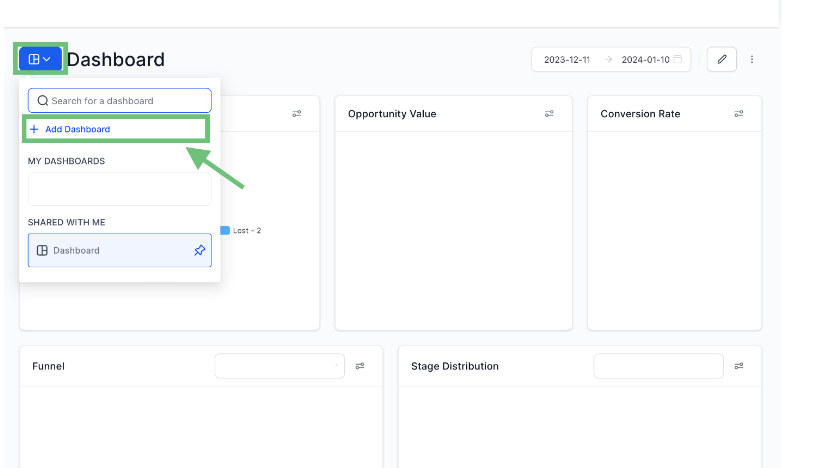
To create a dedicated Calls dashboard, click the icon at the top left and choose Add Dashboard.

Assign a name to your new dashboard, set visibility preferences (Private or Everyone), and confirm.

Use the +Add Widget button to include the necessary call widgets.

After adding widgets, this is how your Calls dashboard will appear.

Deeper Insights with Rich Metrics
These Dashboard Widgets aren’t just about pretty visuals—they’re grounded in powerful, actionable analytics that elevate how you interpret and respond to communication data across your organization:
Analyze the percentage of calls answered versus missed using intuitive bar graphs and graphical charts. Instead of combing through call logs, instantly spot underperformance or success trends in call handling. These visuals help you understand not just the raw numbers, but the broader story behind them—like peak times for missed calls or agents consistently exceeding expectations.
Use the agent status pie chart to gain a real-time understanding of your agent resources. This widget gives you a quick yet detailed look at how many agents are actively engaged, on break, or unavailable during high-traffic hours. It's an essential visual to optimize scheduling and ensure no contact goes unattended.
Track Monthly Trends across various data streams such as the trend of invoices sent, trend of refunds issued, and overall Customer Trend. These real-time metrics allow teams to spot financial patterns, evaluate marketing campaigns, and monitor customer behavior in ways that drive smarter strategy and revenue growth.
Visualize Calls by Status using a dynamic data type structure that adjusts based on your active filters. Whether you're managing priority projects or reviewing daily activity, this widget delivers highly relevant snapshots of call flows—categorized by missed, answered, transferred, or dropped calls—giving managers the context they need to take immediate action.
Custom widgets such as the activity widget, metric widget, and Schedule Widget add additional layers of insight to your dashboard. These can be configured using advanced filtering options like time intervals, agent queues, and even customer segments. The ability to fine-tune what each widget displays means you’re always looking at the most relevant information for your role or department.
Call Widgets in Action
Imagine you’re sitting down to review your sales or support team’s effectiveness. Instead of toggling through countless reports or spreadsheets, your Dashboard Widgets provide an immediate, visual story of how your team is performing. With just a glance, you can instantly assess:
Average call duration using the Average duration widget, which highlights not only how long calls are taking but also provides clues about their quality. Are your calls too short to be meaningful, or too long to be efficient? This widget offers context for improving team scripts, identifying training gaps, and enhancing customer conversations.
Volume of actual calls handled by each individual agent via the agent performance widget. This powerful tool breaks down call traffic by agent, making it easy to reward top performers, support underperforming team members, and align staffing levels with call volumes. It gives you direct visibility into who’s doing what—and how well.
Response times and post-call survey response results with the Agent Performance real-time widget. This is especially useful for tracking how quickly your team engages with leads and how satisfied customers are after the call. By layering in both speed and quality, you gain a full-circle view of the customer experience.
For contact center analytics, these widgets support the complete communication pipeline—tracking everything from count of contacts and contact attempt rates to inbound contact conversion efficiency. Whether it’s a sales-driven follow-up or a support call, you’ll have the metrics to measure outcomes, set new goals, and continuously refine your outreach process.
Tools That Work For You
Every call dashboard is designed to simplify the complexity of communications. By incorporating tools like:
drop-down menu filtering
gear icon customization
Default option resets
export button integration with reports
You’re never stuck with one view. Choose between 15-minute and 30-minute schedule intervals to refine the detail of your reporting.
Track interactions from your (888) 898-4591 Sign line, filter active contact status, and isolate actual service level performance—all within your widget content.
Flexible Configurations for Teams of All Sizes
No two businesses operate the same way, and your dashboard should reflect that.
Whether you're managing individual queues, setting up project folders for segmentation, or enabling visibility by role with SeeManage roles, the flexibility of widget configuration ensures that individual widgets align with your business goals.
Track KPIs like:
One-Time Revenue Trend
trend of coupon redemptions
trend of discount amounts
Or evaluate marketing outreach via Accepted Emails, unsubscribed emails, and contact attempts in one centralized space.
Empowered by Tech: Built on Robust Architecture
The backend power comes from integration with modern development frameworks and APIs:
Use the TypeScript export default class for developers to customize beyond standard settings.
API integration is powered via Azure Functions, back-end Graph API, and Methods Function architecture.
Enable code snippet sharing across dev teams using the export class function.
This technical foundation enables seamless performance and near real-time updates, even in dashboards populated with additional widgets.
Why This Update is a Game-Changer
Customizable dashboards and Dashboard Widgets may sound simple on paper—but in practice, they’re the nerve center of your sales and support workflows. Here’s how the new Call Widgets revolutionize that experience:
Real-Time Monitoring: With Calls per Hour, you can monitor volume fluctuations, align staffing needs, and adjust outreach strategies accordingly.
Performance Insights: The Performers widget lets you rank top agents based on defined KPIs like average survey score or actual call volume.
Forward Planning: Track Upcoming Appointments, view Schedule Widget data, and align efforts with customer trends over time.
Historic Comparison: Leverage the historical widget to compare weekly, monthly, or quarterly Service Queue Performance or outbound productivity.
A Smarter Way to Manage Calls
With every interaction being an opportunity for connection, having precise control over how those interactions are tracked, analyzed, and improved is vital.
The New Call Widgets for the Dashboard bring depth, clarity, and customization into your CRM environment. Whether you're analyzing the bar chart of call status, navigating through a widget file, or using the three-dot menu icon to refine filters, the level of detail available puts you in full control.
You’ll no longer need to rely on external tools to view agent status, inbound contact frequency, or the actual calls made per day. The complete Dashboard list now houses everything you need—from agent performance and queue summaries to Appointment Widgets and visual insights that highlight the difference between actual performance and goals.
So go ahead—start customizing. Empower your team. Track more. Adjust faster. And ultimately, elevate your call management strategy with confidence and precision.
Ready to transform the way you manage your calls? Explore the new Dashboard Widgets today at zapiy.com and unlock smarter, faster, and more insightful communication for your entire team!


Youtube
Facebook
Instagram
LinkedIn
TikTok
X
Pinterest